Forecasting
About forecasting
Forecasting makes it easier to plan your production and your purchases in relation to your sales. You can plan days, weeks and months ahead.
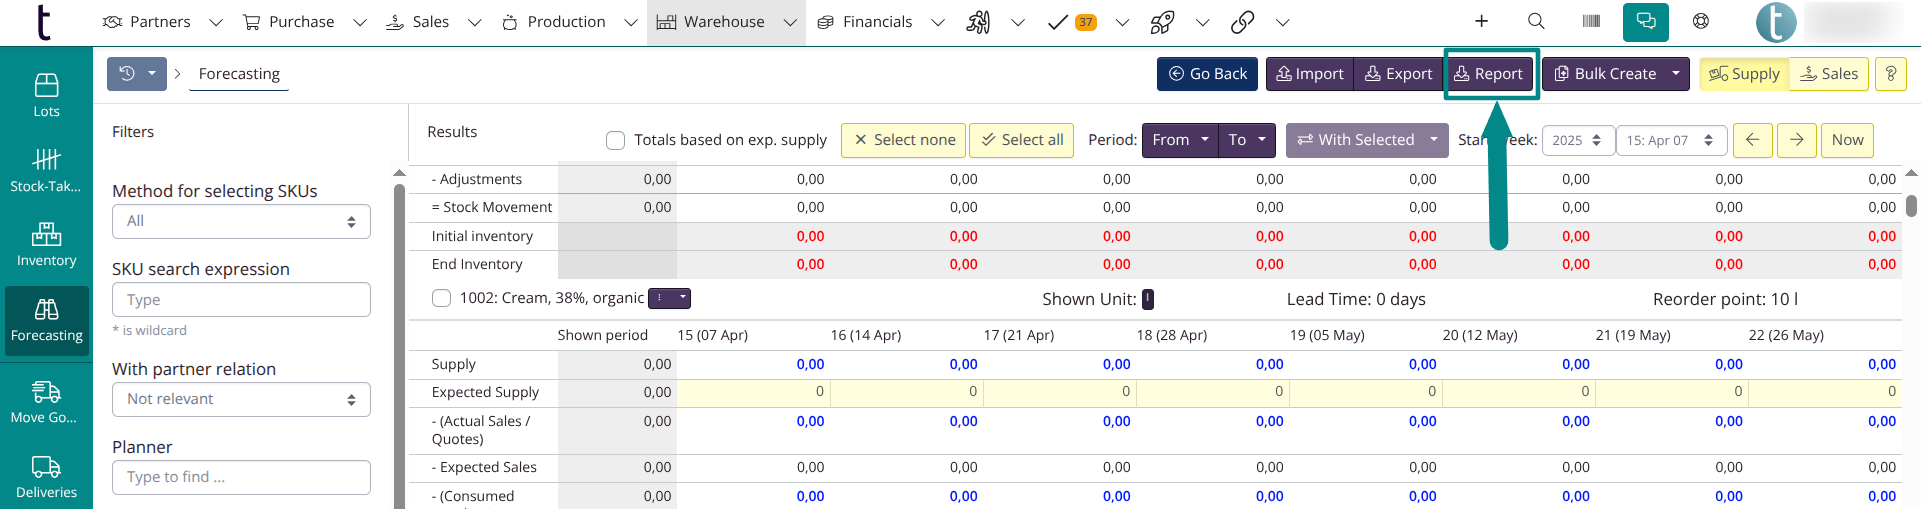
Go to the forecasting feature by clicking Warehouse in the top menu and select Forecasting.
Key functions
You can estimate your sales per customer based on previous sales.
tracezilla estimates your consumption of semi-finished products, raw materials and packaging for the production of finished products based on your recipes.
The forecasting feature takes lead time into account, i.e. the time it takes from the goods being ordered from the supplier until you have received them or the time it takes to produce a product.
The function also takes your reorder point into account, i.e. how many units you must have as a minimum in stock before you need to produce or order new supplies.
Create production orders and purchase orders directly from the forecasting feature.
You can also edit the quantity on an open/pending production order or purchase order if you can see in the forecasting overview that the need for goods has changed.
The forecasting estimate can be based on your current inventory (short-term) or based on your need for goods only based on sales (long-term).
If you expect to introduce a new product and have created a recipe which should apply in the future, the forecasting function can calculate an expected cost price using Cost price simulations. Please note that this requires tracezilla’s Power Pack add on.
How can trading companies use forecasting?
Trading companies will often need 1-2 scenarios, one long-term and one short-term. More scenarios can be created if forecasts are made for more than one location.
1) On the sales side, long-term forecasts can be made, e.g. 3 months ahead. Based on the expected sales, supply is estimated and purchase orders can be created on the supply side.
2) On the supply side, the actual sales (short-term) can be a starting point for the estimation of supply, e.g. 2 weeks ahead. Purchase orders are then created.
How can manufacturing companies use forecasting?
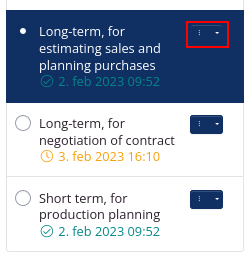
Manufacturing companies will often use forecasting for 2-3 types of scenarios:
1) A short-term for production planning based on current stock and actual sales, e.g. 2 weeks ahead.
2) A (medium) long-term scenario for estimating sales and planning purchases, e.g. 3 months ahead. The estimate is based on sales, so that the purchase of packaging and other raw materials with a long lead time is done in a timely manner.
3) A long-term scenario for estimating sales for the purpose of negotiating contracts for specific customers e.g. 12 months ahead. The estimate can be made on the basis of previous sales figures plus a calculated trend.
Usefull to know before you start using forecasting
The forecasting function uses data from SKUs and recipes. Therefore, you may benefit from reviewing the following before using the feature:
- Set up partner relationship for SKUs if you want to use the forecast based on suppliers of raw materials and finished goods that are sold to certain customers.
- Make SKUs and recipes inactive that are no longer in use.
- Review and update the SKUs and quantities of these that are specified in recipes.
- Set a reorder point for SKUs, i.e. a minimum stock for when new supplies needs to be ordered.
- Specify lead time for SKUs, i.e. the time it takes from the goods being ordered from the supplier until you have received them or the time it takes to produce a product.
- Optionally set up parcel settings for raw materials.
Create a scenario
To start using the forecasting function you create a scenario.
When figures/quantity have been entered or estimated for the expected sales or supply, the numbers are saved in the relevant scenario.
You can create multiple scenarios with different settings.
You created a new scenario on the left by clicking Create Scenario.
Settings in the scenario
| Field | Explanation |
|---|---|
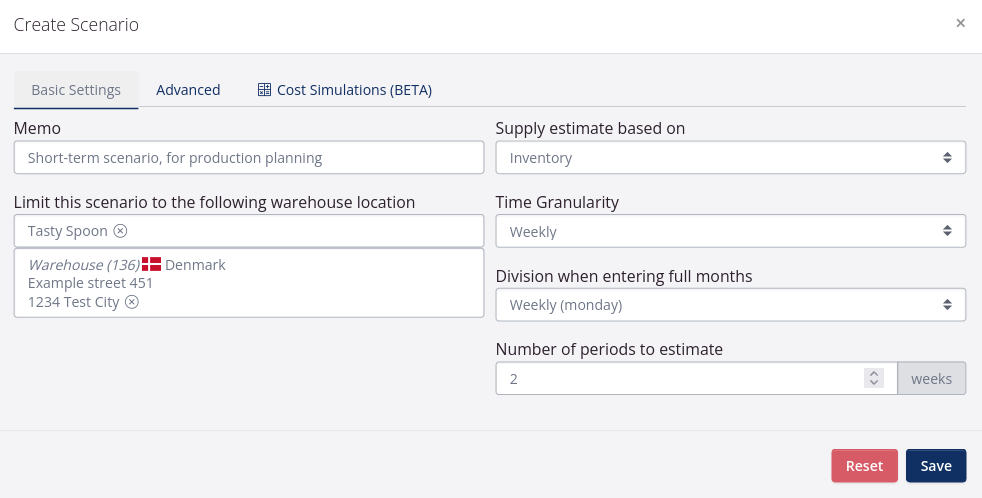
| Memo | Give the scenario a short description or a name by which you will be able to recognize the scenario. |
| Limit this scenario to the following warehouse location | You can select a partner and an associated location to limit the scenario to. The forecasting looks at all locations where goods are kept in stock unless you fill in this field. On the supply side, Initial inventory and End inventory will reflect what is registered in stock at the specified location. |
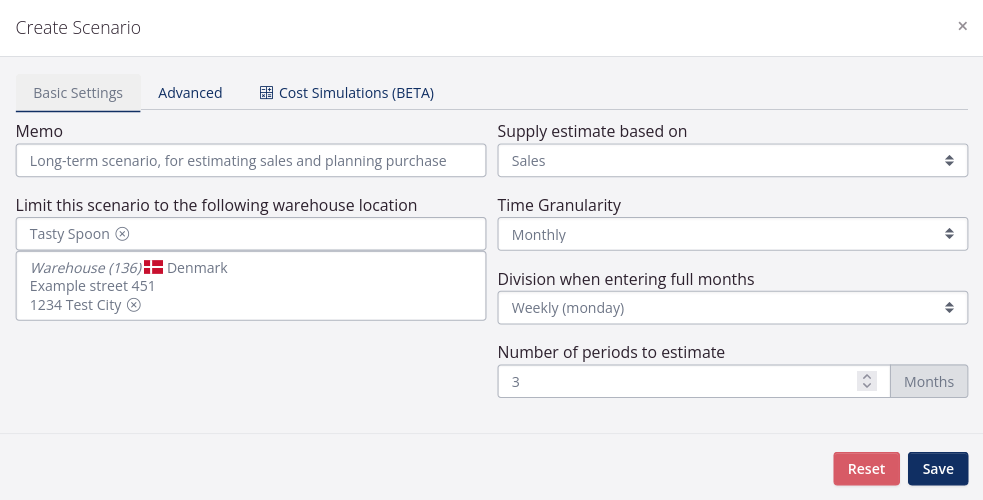
| Supply estimate based on | You can base the forecast on sales or inventory. If you would like to forecast long-term, you can advantageously choose Sales. If you want to estimate supply short term, you can advantageously select Inventory. |
| Time Granularity | Select how you would like to define the period for which you want to forecast. In the forecasting tool itself, you can switch between the different time granularity, e.g. months when estimating sales and weeks when estimating supply for the same scenario, so this is not a final choice. |
| Division when entering full months | If you have selected Time Granularity: Monthly, you can choose how a number should be divided or whether it should be divided. For example, if you expect to sell 200 colli, you can have all 200 colli appear on Monday in the first week of a month, or you can choose that the 200 colli should be divided into weeks (corresponding to four weeks per month), so that per week on Mondays 50 colli appear. |
| Number of periods to estimate | The selected Time Granularity is important for specifying the period to be estimated. For short-term forecasting based on inventory, you can for example choose to estimate two weeks ahead. For long-term forecasting based on sales, you can for example choose to estimate 6 months ahead. |
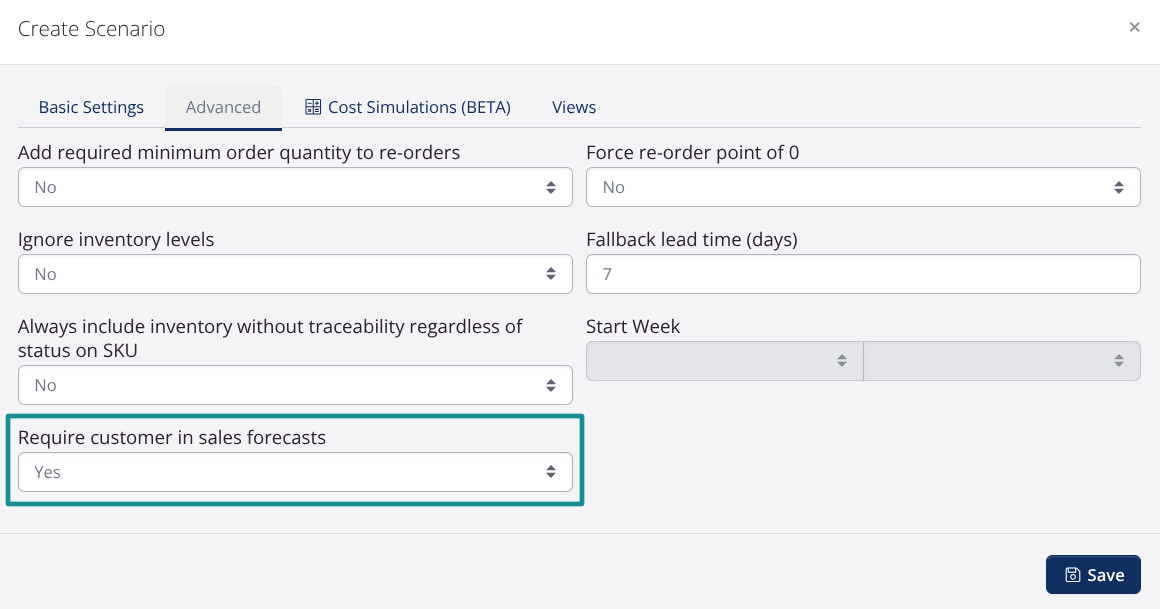
| Ignore inventory levels | NB. this is related to the next field, as it is important for whether the inventory and sales before the specified start day/week/month is ignored. If you plan the supply far into the future, it may be advantageous to ignore the current inventory - if the stock is expected to be sold or consumed before then. In that case, select Yes. If you are planning production for, for example, the next two weeks, select No. |
| Always include inventory without traceability regardless of status on SKU | If a SKU is set up to be traceable in the settings, but the SKU has been moved to a warehouse without traceability, you can still have the quantity displayed in the forecasting overview using this setting. |
| Force re-order point of 0 | If you do not have a concrete reorder point of, for example, 500 units, and you would like to display SKUs of which there are no more in stock, you can choose to “activate” the reorder point of 0. |
| Start day/week/month | If you select Yes to ignore inventory, the start day/week/month field will be unlocked. The selected Time granularity determines whether it is the start day, week or month. |
Example of short-term scenario
Example of (medium) long-term scenario
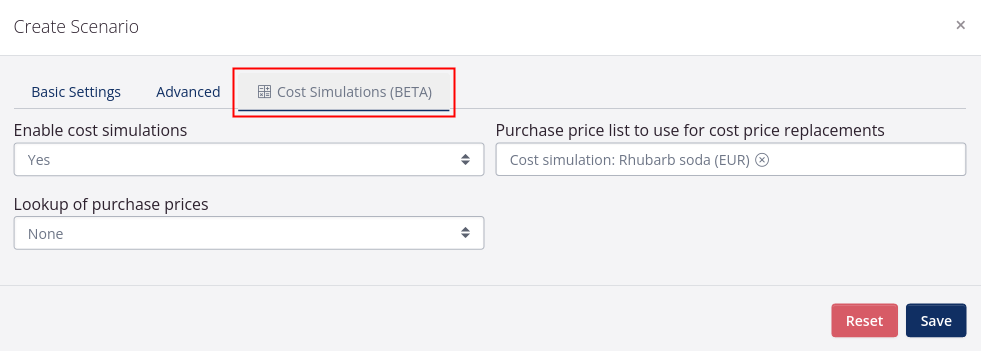
The Power Pack feature Cost Simulations
This is a supplemental guide to creating a scenario where cost simulations are enabled.
| Field | Explanation |
|---|---|
| Enable cost simulations | You can use the feature Cost price simulations to make cost price calculations for new or existing production goods. If you select Yes in this field, the simulation will be performed when a scenario is estimated. Read more about using the feature Cost simulations here. |
| Lookup of purchase prices | You can either use this field or the field Purchase price list to use for cost price replacements for the feature Cost simulations. See the section below. Read more about using the feature Cost simulations here. |
| Purchase price list to use for cost price replacements | You can either use this field or the field Lookup of purchase prices. If you would like to use a price list as a basis for the cost calculations, simply select the price list here. Read more about using the feature Cost simulations here. |
The Lookup of purchase prices feature in Cost simulations
You can choose from the following options:
- None: Looks at the average cost price, which is registered on the goods on previous orders, e.g. purchase price of raw materials and packaging.
- Lowest: Looks in the active price lists, where a price has been specified for the SKU, and looks for the lowest price.
- Highest: Looks in the active price lists, where a price has been specified for the SKU, and looks for the highest price.
- Average: Looks in the active price lists, where a price has been specified for the SKU, and calculates the average of the prices.
Hierarchy when calculating cost prices when None is selected:
The average cost price in the 1) recent quarter. If there are no goods that have been purchased/produced within the latest quarter, tracezilla will calculate the average based on the
2) last six months. If nothing has been purchased/produced within the last 6 months, the calculation will be based on the
3) recent year.
Sales forecast
In the sales forecast you can either
1) Enter the expected sales figures in the yellow row
2) Upload sales figures using the import template
3) Estimate the sales per customer based on previous sales figures and optionally including a trend
1) Enter expected sales
- Select Sales in the top right corner.
- Select scenario in the filter on the left.
- Select Time Granularity day, week or month in the filter on the left.
- Select Start day/week/month at the top right.
- Select which products you would like to enter figures for in the Method for selecting SKUs filter.
- You can enter expected sales for specific customers (optional). If no customer is selected in the filter on the left, the expected sales are generally registered.
- Enter the expected sales figures in the yellow rows next to the SKUs (it is saved automatically).
2) Upload sales figures using the import template
If your customer is forecasting their purchases, it may be that they send this as a file to you as a supplier. In that case, you can copy the figures into the template to import sales figures into forecasting.
You can also download the import template after entering or estimating sales figures, in order to get an overview of the data in the specific scenario.
- Select Sales in the top right corner.
- Select scenario in the filter on the left.
- Select Time Granularity day, week or month in the filter on the left.
- Select Start day/week/month at the top right.
- Select which products you would like to enter figures for in the Method for selecting SKUs filter.
- Click Import in the top right. Then select Get Import Template.
- A file is downloaded. Below you can see instructions for filling in the individual fields.
- Once the numbers have been entered, the file is saved locally on the computer.
- Go back to tracezilla and click Upload in the dialog window from which you downloaded the file.
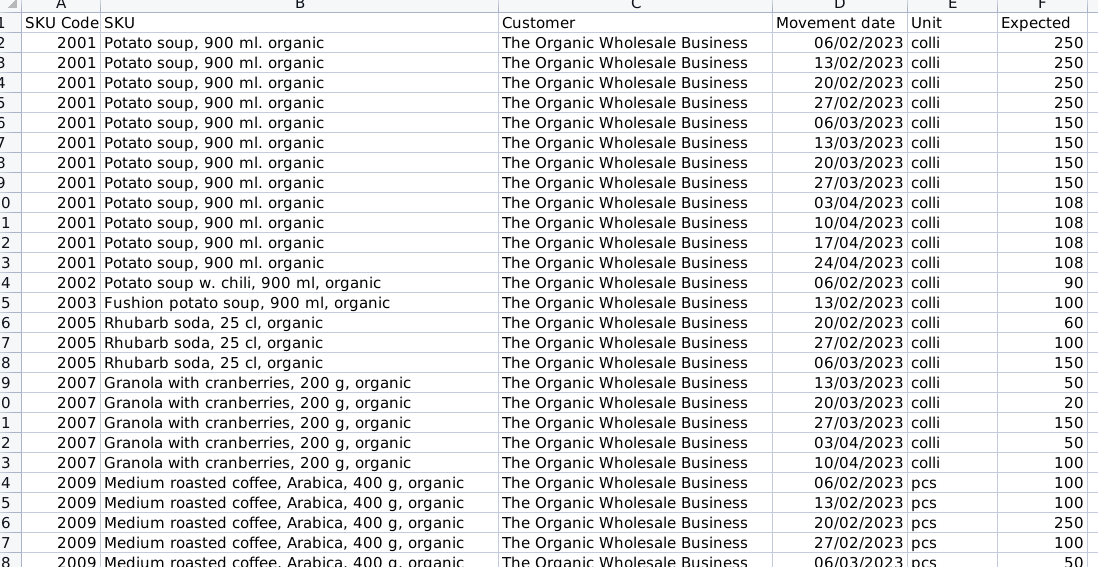
Import demand forecasts
| Column | Explanation |
|---|---|
| SKU Code | Enter or copy your company’s own SKU code, on which the expected sales must be registered. |
| SKU | It is optional to fill in the field. If relevant, copy the name of your SKU that matches the SKU number. The field will automatically be filled in if there was already input or estimation for this SKU before the import template was downloaded. |
| Customer | Copy the company name of the partner (customer) that you expect will buy a given quantity of the SKU in question. |
| Movement date | Enter the date on which the expected sale is to be registered. If you do not know the specific day, the number can be registered on Monday in the given week or on the first day of the month. |
| Unit | It is optional to fill in the field. If relevant, copy in the unit of your SKU, e.g. colli, pcs, kg, litre. The field will automatically be filled in if there was already input or estimation for this SKU before the import template was downloaded. |
| Expected | Copy the quantity of goods that you expect to be sold - of the specified SKU, to the specific customer, on the specific date according to the unit of measure. |
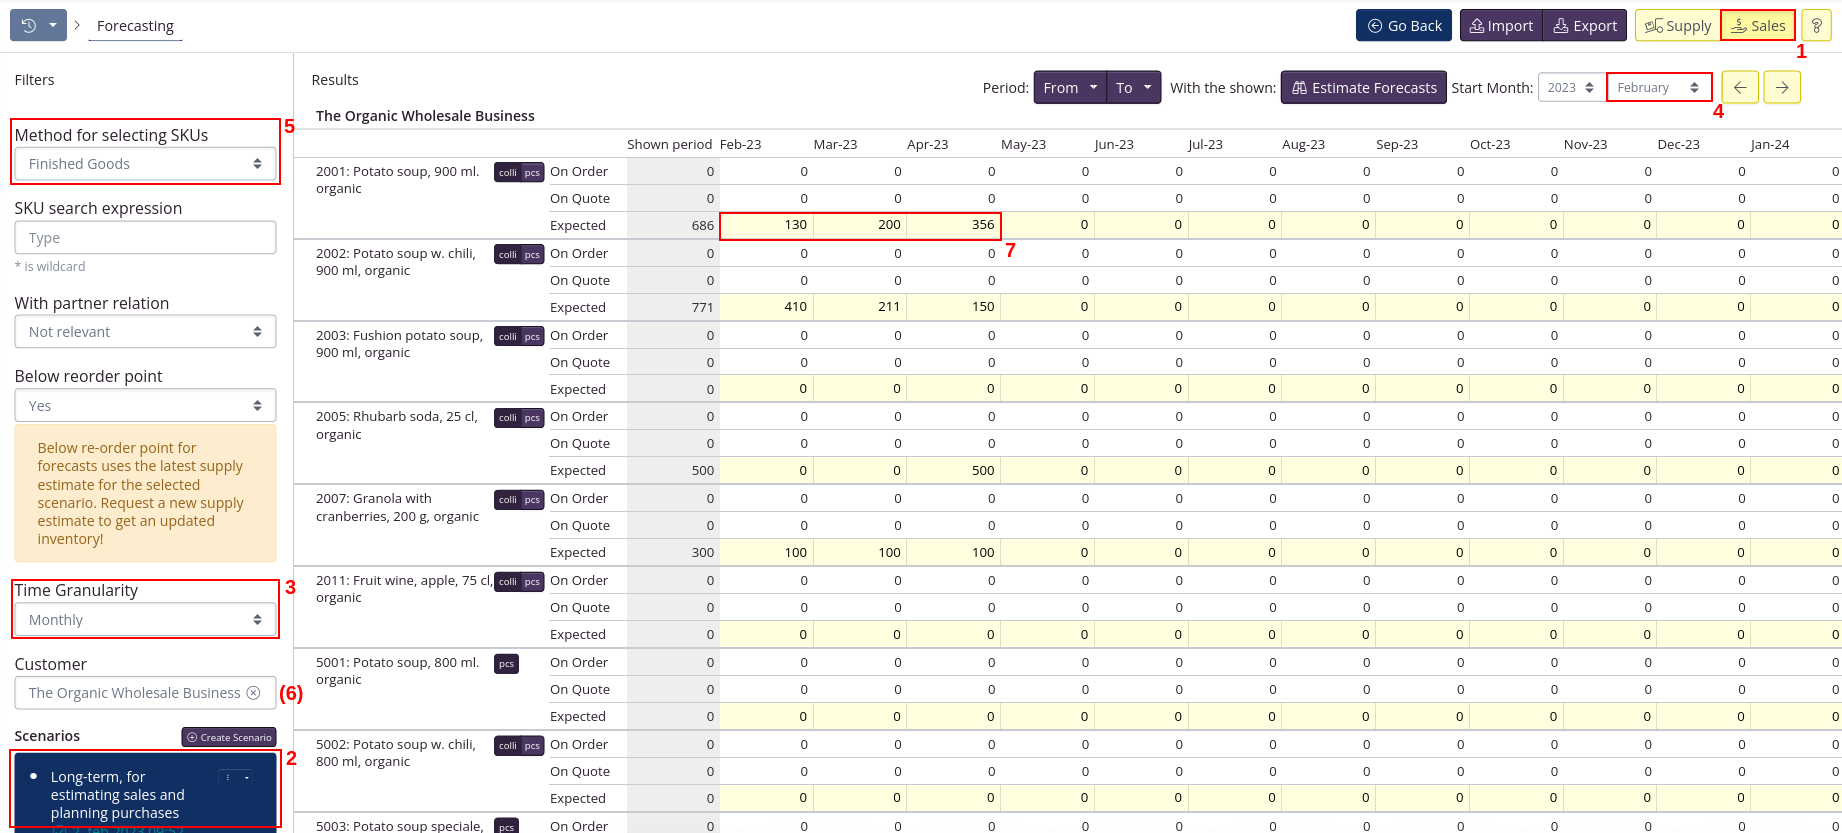
3) Estimate sales per customer
- Select Sales in the top right corner.
- Select scenario in the filter on the left.
- Select Time Granularity day, week or month in the filter on the left.
- Select Start day/week/month at the top right.
- Select the customer for whom you want to estimate sales.
You can also omit selecting a customer, in order to estimate sales in general for all customers. NB! Do not estimate sales for all customers in general and specific customers in the same scenario, as the sales figures for all customers already contain sales figures for the specific customer. You may risk getting artificially high estimates if this is done in the same scenario.
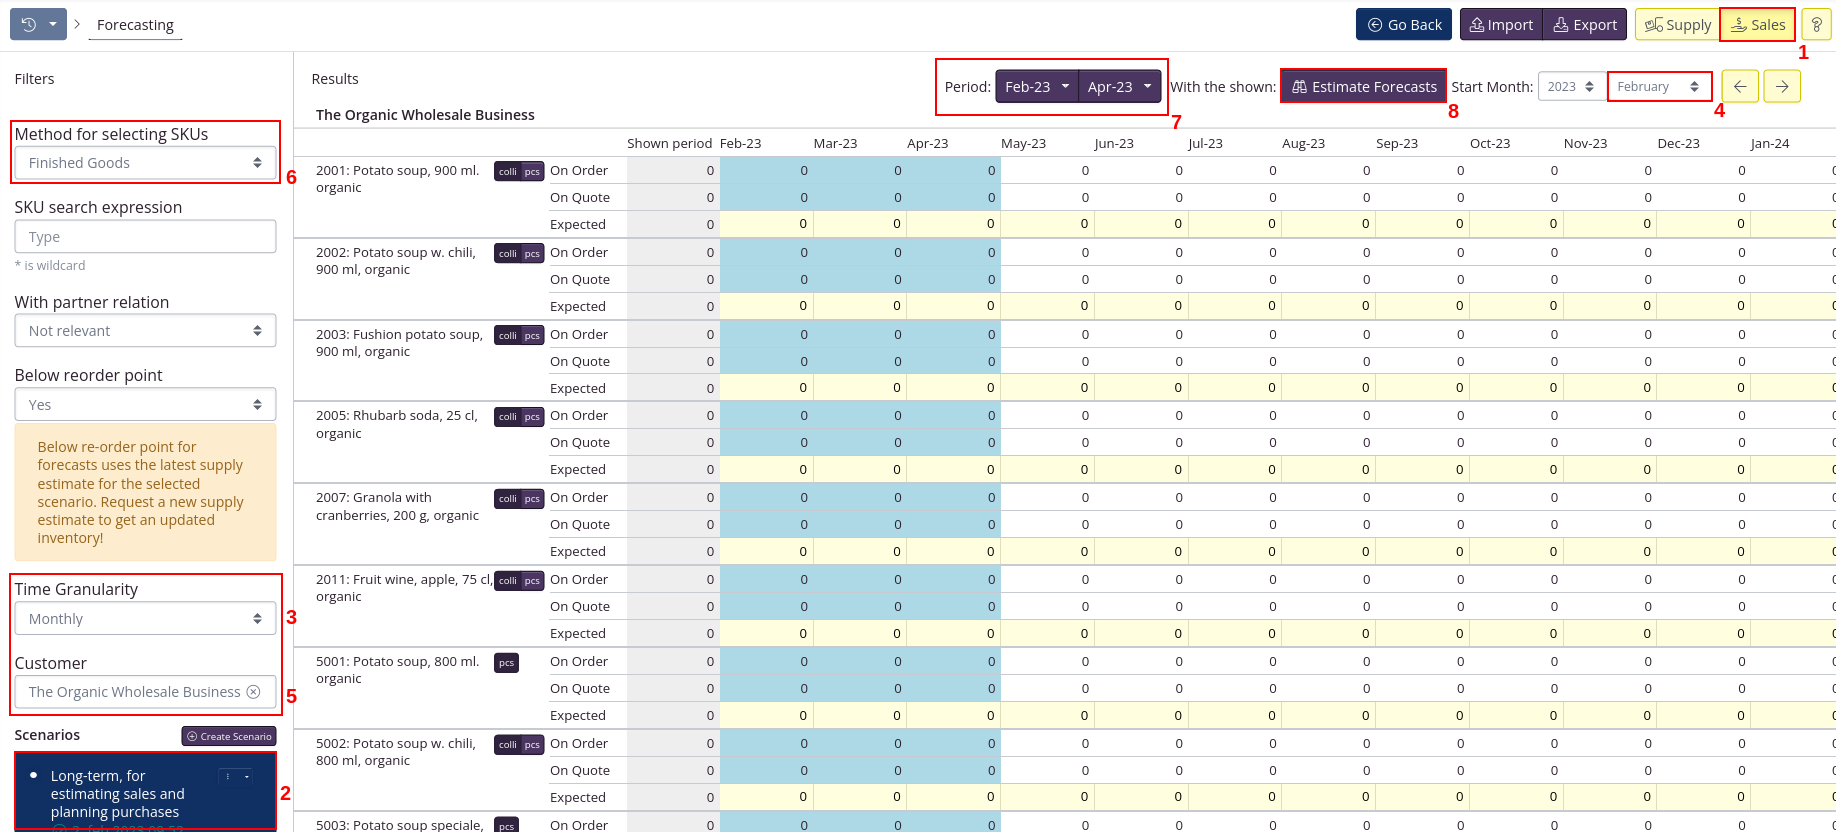
- Select which products you would like to estimate figures for in the Method for selecting SKUs filter.
- Select the period for which the forecasting function is to estimate above the results.
- Click Estimate forecasts.
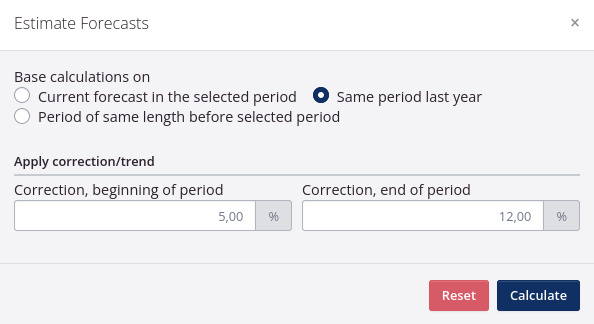
- Select which period the estimate should be based on and thereby retrieve sales figures from the sales report.
- Current forecast in the selected period: Used if some numbers have already been entered or actual sales orders have been created, on which you would like to calculate a trend.
- Same period last year: Sales figures for the selected period the previous year are retrieved. If, for example, March 2023 has been selected, sales figures from March 2022 are retrieved.
- Period of same length before selected period: If a period of e.g. 3 months February, March and April, tracezilla will retrieve sales figures from the three previous months November, December and January.
- If relevant, enter a trend which must be added to the calculation of the sales figures.
- Click Calculate.
Once the estimate for sales is complete, you can estimate the supply to identify which SKUs should be ordered/produced new supplies of.
See section Estimate supply below.
The table in the sales forecast
| Row | Explanation |
|---|---|
| On Order | The sales orders already entered in the application. |
| On Quote | The sales quotes already entered in the application. |
| Expected | Here you can enter your expected sales for the SKU. This is the only row you can enter data into. The other rows indicate sales quotes and sales orders already created. |
Require Customer in Sales Forecasts
It is possible to require that a customer be entered in sales forecasts when uploading the file.
This can be relevant when there are several departments working with the same scenario.
Estimate supply
You can estimate the supply, so tracezilla calculates the consequence of the estimated/entered/uploaded sales for your inventory.
tracezilla estimates supply so that demand is met and inventory is above reorder points.
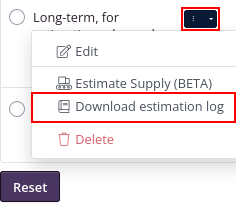
The scenarios can be seen on the left. Click the blue button next to the scenario and select Estimate Supply.
You will receive the message: “A new estimate was requested!”. When the estimate is complete, you will receive a notification by email. A timestamp for the last performed estimate is displayed in blue text. When the estimate is in progress, it is displayed in orange text.
Create production orders and purchase orders from the forecasting feature
- Select Supply in the top right corner.
- Select scenario in the filter on the left.
- Select Time Granularity day, week or month in the filter on the left.
- Select Start day/week/month at the top right.
- Select which products you would like to create orders for in the Method for selecting SKUs filter.
If you would like to create a production order, you can specify Finished goods in the filter. If you would like to create purchase orders, you can for example select Raw materials or Packaging in the filter.
- Select a period for which you would like to create orders for above the results.
- Tick the boxes next to the SKUs for which you would like to create orders.
- Click Create order and select the order type that you would like to create.
- Fill in the order details. You can optionally enter a note on the order stating that it is based on forecasting.
- Click Save. A draft order will be created.
Alternatively, you can create multiple purchase or production orders at once.
Then click Bulk create and then Purchase orders.
tracezilla will then create the purchase orders based on the SKUs that are below the reorder point in the selected period, and based on which supplier is specified in the partner relationship for the SKU. If several suppliers are specified, tracezilla will look in the price lists to see which supplier has the lowest price for the raw material in question.
The table in the supply forecast
| Heading | Explanation |
|---|---|
| Supply | The supply added to your inventory from production orders and purchase orders in the period. |
| Expected supply | You can enter your expected supply here. |
| - (Actual Sales/Quotes) | The actual sales on sales orders and sales quotes already entered in the application. |
| - Expected sales | Here you can enter the expected sales for the SKUThis is the only row you can enter data into. The other rows are calculations based on stock movement and the expected sales that you entered. If you already entered expected sales in the sales forecasting table, it will appear here. NB. The expected sales must include the actual sales/quotes. |
| - Consumed (production) | Indicates what has been consumed in production of the SKU in the period. |
| - Estimated consumption for production | The expected amount of raw material consumed in production. |
| - Adjustments | Indicates any waste or loss in the period. |
| = Stock Movements | Sums up the stock movements of the period, i.e. what went in or out of stock in total. |
| Initial Inventory | Your inventory at the beginning of the period. |
| End Inventory | Your inventory at the end of the period. |
More about estimating supply
When you estimate supply in forecasting, it happens in a background run. This ensures that the estimate is done faster, and you work with other tings in tracezilla in the meantime. You will automatically receive an email with the message “Forecasting succeeded” when the estimate is complete.
The “estimation engine” runs in iterations until there are no more SKUs that come below the reorder point or below 0. tracezilla runs up to 10 iterations.
You can view an estimation log, which tells you what data the calculations are based on and during which iteration this data was calculated.
You can view the estimation log by clicking the blue button next to the scenario and then Download Estimation Log.
More about the filters to the left of the results
| Filter | Explanation |
|---|---|
| Method for selecting SKUs | Select which SKUs you want to view and forecast for. For example, you can estimate sales and select Finished goods in this field. Finished goods are also relevant in relation production planning. For example, you can plan supply for the categories Raw materials and Packaging. |
| SKU search expression | Use the filter to search for all the SKUs which names contain some of the same words. The word you want to search by should be surrounded by an asterisk/wildcard (*). When searching for *soup*, for example, SKUs with names like potato soup, pumpkin soup, elderberry soup, etc. are displayed. |
| With partner relation | If you have specified a partner relation in the SKU settings (read more) to a specific customer/supplier/producer, you can use this to filter the results. If you want to estimate sales for a specific customer, you can use the filter to view only the relevant SKUs that are sold to this customer, for example Private label products. |
| Below reorder point | View all SKUs which inventory levels gets below the given reorder point that are set in the SKU settings based on the most recent estimate for supply. The goods that are expected to go out of stock will also appear in the results. |
| Time Granularity | Select whether you want to see the results in the forecasting overview per day, week or month. |
| Shown Elements | You can tick the boxes or remove the tick so they do not appear in the results. Then there will be fewer rows per SKU with information. You can always remove/add the elements again when you switch views between Sales and Supply. The row showing Warehouse movements will only appear if you have selected a specific location in the scenario. |
More about shortcuts and settings in the forecasting feature on the supply page
| Short cut/setting | Explanation |
|---|---|
| Totals based on exp. supply | Tick the box if you want to see what effect the expected supply has on the figures for End inventery. This means that you will be able to see the effect on your inventory if you purchase/produce the quantity of goods that is entered in the Expected supply field. |
| Pick supplier / Pick producer | A shortcut on the right to be able to select a specific supplier-partner or producer-partner in the filter to the left. It requires that you have specified partner relations in the set-up of SKUs. By filtering for a specific supplier or manufacturer, you can view a list of all the goods that you order from the partner in question and, based on that, order new supplies. |
| Select none / Select all | You can tick the boxes for the individual SKUs in the list to create a purchase order or production order based on the forecasting’s expected lack of supply. You can remove all ticked boxes by clicking Select none. You can tick all the boxes at once by clicking Select All. |
| Raw materials to this SKU | If you have selected Finished goods or Intermediate goods in the filter Method for selecting SKUs and have a recipe associated with the SKU in question, you will be able to see a list of the raw materials and packaging included in the recipe for this end product. |
| Produces goods from this SKU | If you have created recipes and a given raw material is included in one or more recipes, you can get an overview of produced goods that come from this raw material. |
Supply report
You can export the supply table to a rain program.